Compare two or more Excel columns and calculate match percentage
When you have several comparable items in an Excel table, it is common to arrange data in columns with different attributes across rows. E.g. car models, phones, experimental and control groups, stores in a retail chain, etc. With large number of rows visual analysis will be inconclusive. VLOOKUP, INDEX and MATCH functions provide only cell-by-cell comparison and do not give a general picture. How can you find out whether the data sets are similar to each other? Are the columns identical?
The Match Columns add-in helps match columns and get a big picture:
- Compare two or more columns with each other
- Compare columns against benchmark values
- Calculate the exact match percentage
- Summarize results in crosstab table
Before you begin, add Match Columns to Excel
Match Columns is one of the 20+ features within XLTools Add-in for Excel. Works in Excel 2019, 2016, 2013, 2010, desktop Office 365.


How to compare two or more columns with each other and calculate the match percentage
Let's take a product development example. Suppose, you want to compare product prototypes with each other and find out how much similar, different or maybe even identical they are.
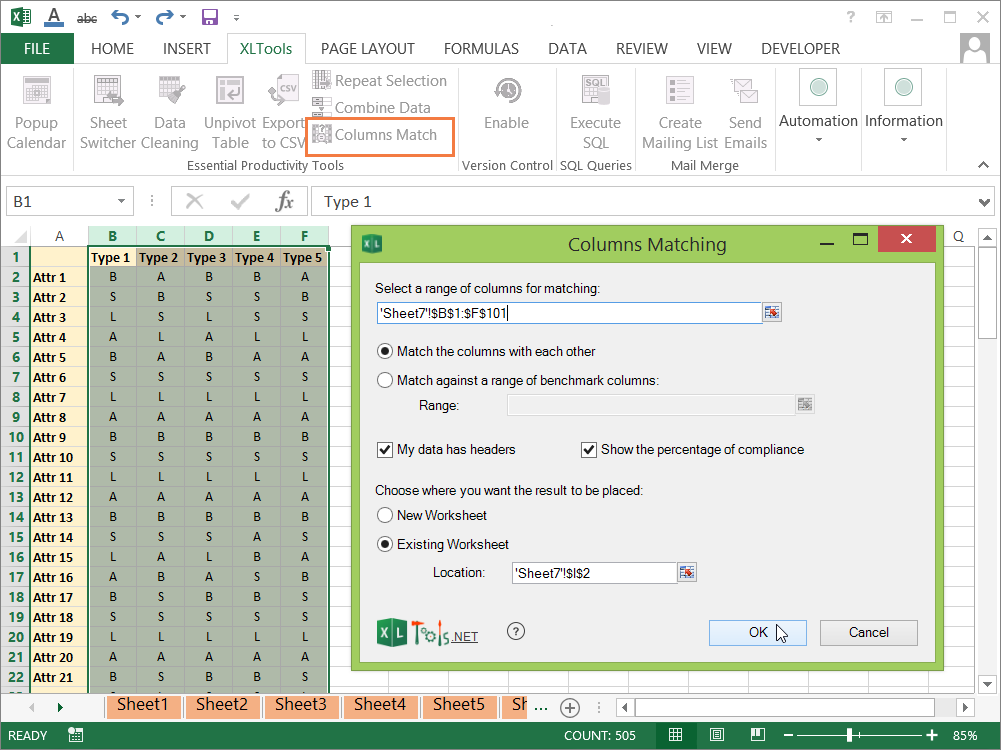
- Select the columns which you want to compare.
- Click Match Columns on XLTools tab Select Match the columns with each other.
- Tick My data has headers if it does.
- Tick Show the percentage of compliance to display the match percentage.Otherwise, the match level will display as 1 (complete match) or 0 (no match).
- Choose where to place the results – in a new or an existing worksheet.
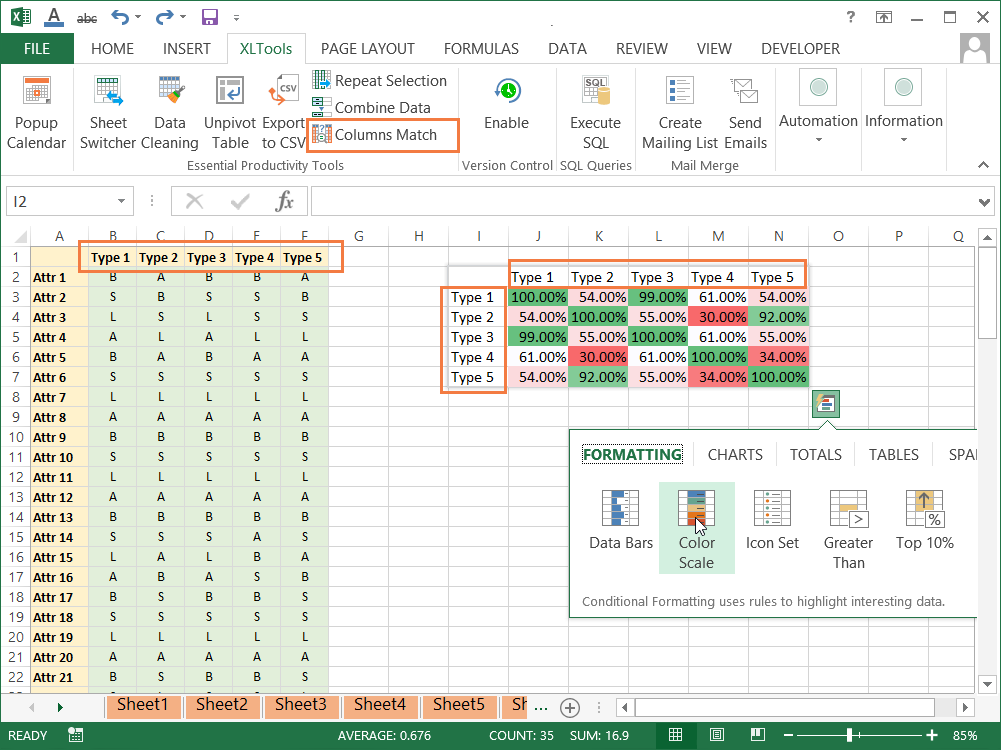
- Click OK Done, results are presented in the crosstab table.

Tip:apply conditional formatting. It will be easier to interpret the results:
Select the output table Click the Quick Analysis icon Apply Color Scale.
Select the output table Click the Quick Analysis icon Apply Color Scale.
Review results: Type 1 and Type 3 prototypes are almost identical – the 99% match reveals that 99% of their parameters in rows match. Type 2 and Type 4 are the least similar – the parameters match only by 30%.
How to compare columns against benchmark values and calculate the degree of compliance
Let's take a product development example. Suppose, you want to compare product prototypes against a set of standards, as well as measure their degree of compliance to these benchmark values.
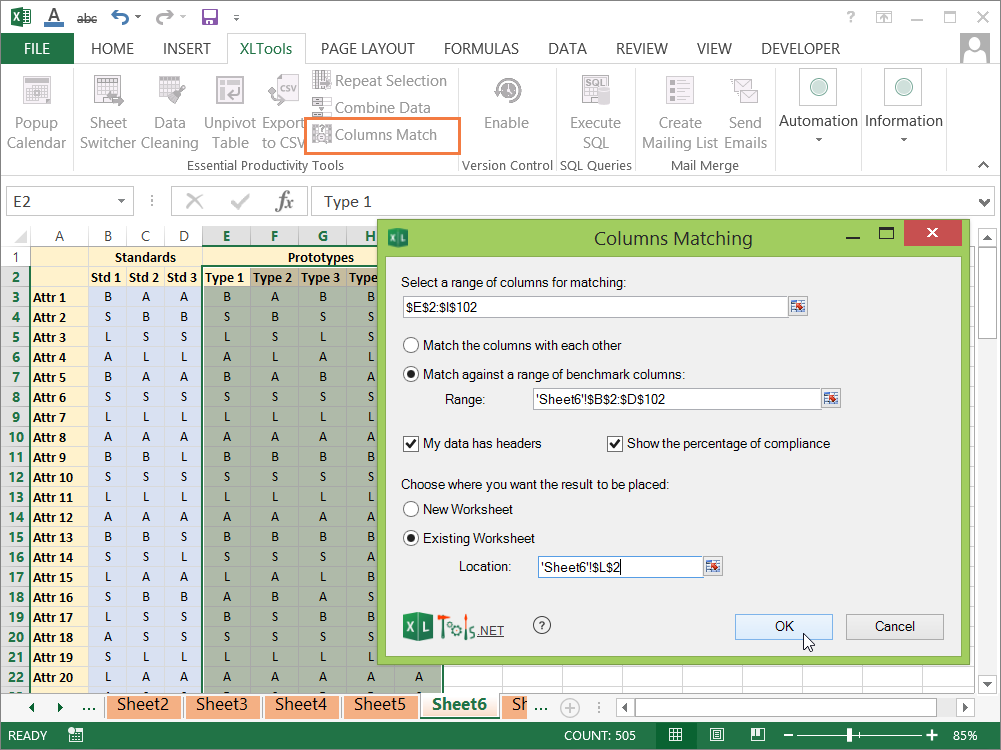
- Select the columns which you want to compare.E.g. columns with prototypes data.
- Click on the Match Columns button on XLTools tab.
- Select Match against the range of benchmark columns Select the benchmark columns.E.g. columns with standards.
- Tick My data has headers if it does.
- Tick Show the percentage of compliance to display the match percentage.Otherwise, the match level will display as 1 (complete match) or 0 (no match).
- Choose where to place the results – in a new or an existing worksheet.
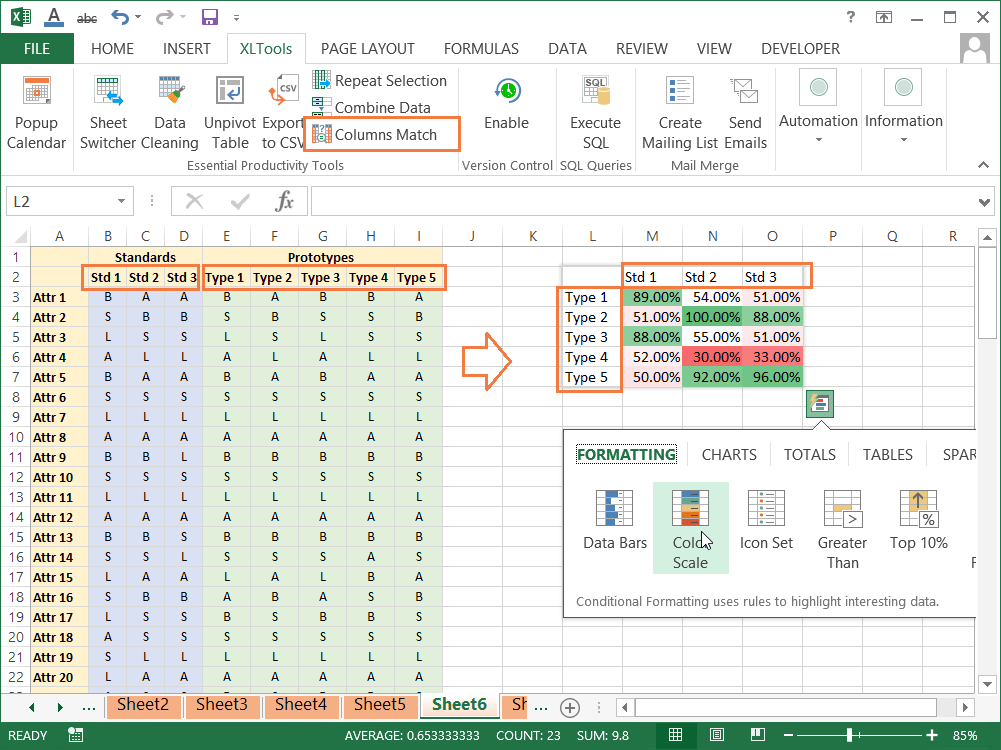
- Click OK Done, results are presented in the crosstab table.
Tip:apply conditional formatting. It will be easier to interpret the results:
Select the output table Click the Quick Analysis icon Apply Color Scale.
Select the output table Click the Quick Analysis icon Apply Color Scale.
Review results: Type 2 prototype is a 100% match to Standard 2, which means that 100% of their parameters in rows are identical. Type 5 is the closest match to Standard 3 with 96% match. Now you can make a conclusion, how far each of the prototypes deviates from the benchmarks.
When the Match Columns add-in is most useful
The add-in scans cells row by row, and then calculates the percentage of identical values in columns. XLTools Columns Match is not suitable for common cell-by-cell comparison – it is not designed to find duplicate or unique values.
The Match Columns add-in has a different purpose. It aims to answer how much – in general – the data sets (columns) are similar or different. The add-in is helpful for analysis of large data sets, when you need a bigger 'macro-level' picture, e.g. answer questions like:
- How does the performance of experimental groups compare
- How do the results of experimental and control groups compare
- How similar/different are multiple products within one category
- How do the employee KPIs compare to the target values
- How does the performance of several retail stores compare, etc.
Any questions or suggestions?

